|
|
Post by BRTNWXMAN on Feb 6, 2014 23:45:30 GMT -6
|
|
fareastwx21
Wishcaster
 Clay County, Illinois on the banks for the Little Wabash
Posts: 189 
|
Post by fareastwx21 on Feb 7, 2014 9:52:31 GMT -6
DT made a very good comment about the possible effects, if the Maunder Min was responsible for global cooling, about the agriculture production of the planet and the future.
Many of us forget the underlying cause of the revolution in Eygpt began in 2008 with wheat shortages. Living in the US we don't think about food being unavailable, some people go hungry but not because there is no food.
We live in a world today that could explode into revolution if there was a multi-year crop failure across a good portion of the northern hemisphere.
While there would be a point where warming would significantly impact agriculture, but only then if it were accompanied by drought, cooler temperatures would play havoc across much of the most fertile land in the world. If you look at Canada, the US, eastern Europe and other places in the north, I believe there is little doubt cooler global temperatures could cause massive problems.
|
|
|
|
Post by csnavywx on Feb 7, 2014 11:38:48 GMT -6
Northern hemispheric extratropical mean temperature isn't global temperature, or even a decent approximation of global temperature.
There are a number of other problems with trying to use this to support solar activity as the driver of this temperature change, including (just to name a couple):
1) A decrease of arctic sea ice during this time period from multiple proxy records, indicating heat transport changes as a more likely culprit.
2) No evidence of a drop elsewhere in the world.
3) A wild assumption about climate sensitivity. If the climate was this sensitive to such a small change in solar output, what do you think large changes in radiative forcing from Tyndall gasses will do? As I've posted before, you can't get around this problem using the solar argument, because it does not matter where the heat source comes from, it will change the global temperature.
|
|
fareastwx21
Wishcaster
 Clay County, Illinois on the banks for the Little Wabash
Posts: 189 
|
Post by fareastwx21 on Feb 7, 2014 13:16:56 GMT -6
Historical records are clear arctic sea ice increased during the period of the little ice age, at least on the atlantic side.
|
|
fareastwx21
Wishcaster
 Clay County, Illinois on the banks for the Little Wabash
Posts: 189 
|
Post by fareastwx21 on Feb 7, 2014 13:45:46 GMT -6
Scripts' researchers released a paper in 2012 that indicated the little ice age was indeed a global event.
Sure it might not have been 1.1 degrees everywhere but there is a signal for a global event.
I understand if you want global warming to be true that is inconvient but it seems to be the case.
As to the northern hemisphere being where the 1.1 colder came from I would fully expect the northern hemisphere to be colder than the south because of the greater land area.
|
|
|
|
Post by csnavywx on Feb 7, 2014 21:26:17 GMT -6
Scripts' researchers released a paper in 2012 that indicated the little ice age was indeed a global event. Sure it might not have been 1.1 degrees everywhere but there is a signal for a global event. I understand if you want global warming to be true that is inconvient but it seems to be the case. As to the northern hemisphere being where the 1.1 colder came from I would fully expect the northern hemisphere to be colder than the south because of the greater land area. I would like to continue talking about this, but let's get one thing crystal clear here. My responses in this thread have absolutely nothing to do with belief or opinion. They are of little to no use in scientific discourse. I feel I've backed up (and will continue to back up) everything I've said here with actual data sources and solid analysis (or at least links to solid analysis). Please do not seek to turn this into a personal message. For the record, I don't want global warming to be true, but my wants and wishes are irrelevant when it comes to science.Now back to the matter at hand: Again, it's not even Northern Hemispheric temperature, it's Northern Hemispheric extra-tropical temperature (north of 22N). There's still a big difference there (about 20% of the globe). The tropics are big. We're also talking about 1 paper, in which the authors admit right in the abstract, that it contradicted numerous other reconstructions that argued for a lesser amount (around -0.6C) AND listed the strengths and weaknesses of the method they used. So to lean on this paper alone and ignore the other reconstructions is probably not a great idea. Interesting paper? Yes, quite. But maybe not in the way you thought: Reconstructions of Arctic Sea Ice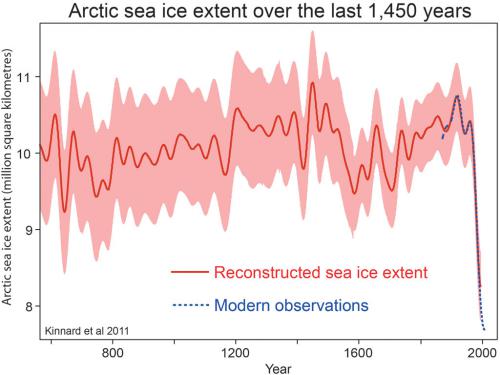 This really brings up another point. Was the change coincident across the globe? Arctic data suggests it wasn't. In fact, we see a fairly reliable signal of decrease in ice coverage at this time, especially over the regions where the Atlantic meets the Arctic or feeds it via warmer water currents. This suggests heat displacement, not just removal. Thing is, it's not just across the Arctic. There are cooler periods in other parts of the world, but they are, for the most part, not synchronous, indicating changes in heat transport via ocean current changes and atmospheric circulation changes were also important. Yes, there is evidence that the Sporer, Maunder and Dalton minimums helped reduce global temperature, but not by huge amounts. Again, even if you argue that this is wrong, and that these changes in the LIA are large, then you are also arguing for a very high climate sensitivity. This means climate will also be very sensitive to CO2, CH4, etc. This point is not something you can successfully argue your way out of. We know how Tyndall gasses behave. We do not see this apparent pattern between solar activity and temperature in recent (last 50 year) temperature records. Solar activity has declined since its mid-20th century peak, but temperature firmly rose 0.5-0.6C since the late 70s. This was even predicted ahead of time, even though Wally Broeker didn't fully guess the full extent of SO2 emissions on the lower atmosphere: www.sciencemag.org/content/189/4201/460.abstract |
|
|
|
Post by guyfromhecker on Feb 8, 2014 12:17:42 GMT -6
Scripts' researchers released a paper in 2012 that indicated the little ice age was indeed a global event. Sure it might not have been 1.1 degrees everywhere but there is a signal for a global event. I understand if you want global warming to be true that is inconvient but it seems to be the case. As to the northern hemisphere being where the 1.1 colder came from I would fully expect the northern hemisphere to be colder than the south because of the greater land area. I would like to continue talking about this, but let's get one thing crystal clear here. My responses in this thread have absolutely nothing to do with belief or opinion. They are of little to no use in scientific discourse. I feel I've backed up (and will continue to back up) everything I've said here with actual data sources and solid analysis (or at least links to solid analysis). Please do not seek to turn this into a personal message. For the record, I don't want global warming to be true, but my wants and wishes are irrelevant when it comes to science.Now back to the matter at hand: Again, it's not even Northern Hemispheric temperature, it's Northern Hemispheric extra-tropical temperature (north of 22N). There's still a big difference there (about 20% of the globe). The tropics are big. We're also talking about 1 paper, in which the authors admit right in the abstract, that it contradicted numerous other reconstructions that argued for a lesser amount (around -0.6C) AND listed the strengths and weaknesses of the method they used. So to lean on this paper alone and ignore the other reconstructions is probably not a great idea. Interesting paper? Yes, quite. But maybe not in the way you thought: Reconstructions of Arctic Sea Ice This really brings up another point. Was the change coincident across the globe? Arctic data suggests it wasn't. In fact, we see a fairly reliable signal of decrease in ice coverage at this time, especially over the regions where the Atlantic meets the Arctic or feeds it via warmer water currents. This suggests heat displacement, not just removal. Thing is, it's not just across the Arctic. There are cooler periods in other parts of the world, but they are, for the most part, not synchronous, indicating changes in heat transport via ocean current changes and atmospheric circulation changes were also important. Yes, there is evidence that the Sporer, Maunder and Dalton minimums helped reduce global temperature, but not by huge amounts. Again, even if you argue that this is wrong, and that these changes in the LIA are large, then you are also arguing for a very high climate sensitivity. This means climate will also be very sensitive to CO2, CH4, etc. This point is not something you can successfully argue your way out of. We know how Tyndall gasses behave. We do not see this apparent pattern between solar activity and temperature in recent (last 50 year) temperature records. Solar activity has declined since its mid-20th century peak, but temperature firmly rose 0.5-0.6C since the late 70s. This was even predicted ahead of time, even though Wally Broeker didn't fully guess the full extent of SO2 emissions on the lower atmosphere: www.sciencemag.org/content/189/4201/460.abstractSolar activity declined little over the last half of the 20th C. Arguably it stayed very strong. One average, the last three cycles of the 20th C were as great as any ever measured. Even with the slight decline you speak of the last three cycles are above the levels most of the previous 4 centuries. Have you ever heard of momentum? In the 20th Century we had 5 of the strongest cycles ever measured. Even the "down" cycle of the mid century was not on par with anything related to cooling. This Modern Maximum is the only one we have witnessed. It is not surprising that we do not really know the consequences of it. |
|
|
|
Post by guyfromhecker on Feb 10, 2014 17:01:44 GMT -6
Here is one of the best graphs to get a grasp on what the modern Maximum was like. Sure it had a peak, but the sustained output for over 60 years (1940-2000) was greater than any seen before. ![]() The earth pretty much had no choice about warming. 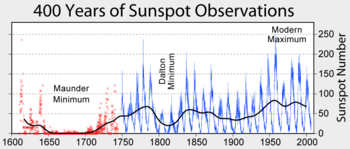 |
|
|
|
Post by csnavywx on Feb 11, 2014 18:07:27 GMT -6
It doesn't take nearly that long for changes in solar output to influence temperatures. The equilibrium response is on the order of 15 yr. Much of the response is quicker than that (see Pinatubo eruption or this paper, for instance). If output does not change, neither will temperature. It's all about change over time, and more specifically, the rate of change over time that's important in climate.
|
|
|
|
Post by guyfromhecker on Feb 11, 2014 19:31:22 GMT -6
It doesn't take nearly that long for changes in solar output to influence temperatures. The equilibrium response is on the order of 15 yr. Much of the response is quicker than that (see Pinatubo eruption or this paper, for instance). If output does not change, neither will temperature. It's all about change over time, and more specifically, the rate of change over time that's important in climate.
So if the output goes down the temp just drops like a rock to whatever it is going to reach? I mean if one cycle is low you are gonna be as cold as if you strung 3 together? Yoo hoo, what happened to that little thing called feedback, among other things? |
|
|
|
Post by guyfromhecker on Feb 11, 2014 19:42:54 GMT -6
Old sunspot AR1944 has just come across the western limb and has been renumbered AR1967. It is still a large sunspot that has shown activity in the last several days. NASA is forecasting a 30% chance of class-M flares and 5% of X flares in the coming days. Other than this active region sunspot levels have fallen to 62 after several days above 100. AR1967 has made the headlines! |
|
|
|
Post by csnavywx on Feb 11, 2014 23:32:33 GMT -6
It doesn't take nearly that long for changes in solar output to influence temperatures. The equilibrium response is on the order of 15 yr. Much of the response is quicker than that (see Pinatubo eruption or this paper, for instance). If output does not change, neither will temperature. It's all about change over time, and more specifically, the rate of change over time that's important in climate.
Yoo hoo, what happened to that little thing called feedback, among other things? Italics: What we saw with Pinatubo should give you a good general idea as to what screening the sun does. They're both short-lived forcings. The difference being Pinatubo's radiative forcing change was much bigger and more abrupt. Solar forcing's amplitude is generally pretty small. This is the reason effective equilibrium is reached fairly quickly (~15yr, though in practice never more than 11 yr due to the cycle essentially interrupting that process). Even a cycle with twice that amplitude wouldn't have an equilibrium time much over 50 yr (provided it wasn't near a critical point of glaciation/deglaciation/hothouse). Bold: You could see a number of slight feedbacks working on much longer timescales, but they will essentially be unmeasurable in the temperature record, namely because the triggering mechanism wasn't strong. The stronger the trigger, the more likely non-linearity will come to the fore with these feedbacks and change the equation, and vice versa. As a result, stringing together 3 cycles of equal strength doesn't really change solar forcing any appreciable amount. Now, if these cycles were growing significantly in amplitude each time, you'd have a point (and this is why we are pretty sure solar was a significant component of early 20th century warming). Luckily, feedbacks are inherently self-limiting processes. They are generally proportional to the size of the trigger both in amplitude and on the temporal scale as well. Even with CO2, the bulk of the temperature response typically occurs in 10 years (around 65%), with the remainder occurring over much longer timescales due to the persistence of the gas in the atmosphere. As a result, we are pretty well in equilibrium with where CO2 concentrations were 30 years ago. Again, as I mentioned earlier, the ocean flywheel tends to muddy things up by causing heat exchange with the atmosphere to fluctuate unpredictably on short-medium timescales. |
|
|
|
Post by guyfromhecker on Feb 13, 2014 19:34:24 GMT -6
So if the output goes down the temp just drops like a rock to whatever it is going to reach? I mean if one cycle is low you are gonna be as cold as if you strung 3 together?
Yoo hoo, what happened to that little thing called feedback, among other things? Italics: What we saw with Pinatubo should give you a good general idea as to what screening the sun does. They're both short-lived forcings. The difference being Pinatubo's radiative forcing change was much bigger and more abrupt. Solar forcing's amplitude is generally pretty small. This is the reason effective equilibrium is reached fairly quickly (~15yr, though in practice never more than 11 yr due to the cycle essentially interrupting that process). Even a cycle with twice that amplitude wouldn't have an equilibrium time much over 50 yr (provided it wasn't near a critical point of glaciation/deglaciation/hothouse). Bold: You could see a number of slight feedbacks working on much longer timescales, but they will essentially be unmeasurable in the temperature record, namely because the triggering mechanism wasn't strong. The stronger the trigger, the more likely non-linearity will come to the fore with these feedbacks and change the equation, and vice versa. As a result, stringing together 3 cycles of equal strength doesn't really change solar forcing any appreciable amount. Now, if these cycles were growing significantly in amplitude each time, you'd have a point (and this is why we are pretty sure solar was a significant component of early 20th century warming). Luckily, feedbacks are inherently self-limiting processes. They are generally proportional to the size of the trigger both in amplitude and on the temporal scale as well. Even with CO2, the bulk of the temperature response typically occurs in 10 years (around 65%), with the remainder occurring over much longer timescales due to the persistence of the gas in the atmosphere. As a result, we are pretty well in equilibrium with where CO2 concentrations were 30 years ago. Again, as I mentioned earlier, the ocean flywheel tends to muddy things up by causing heat exchange with the atmosphere to fluctuate unpredictably on short-medium timescales. Well, looking at the graph I have below you would think everything would be in neat 15 year trends. Temp would go up for 15 or down for 15 or stay the same. It doesn't though. Trends seem to be more on the 30yr and longer. 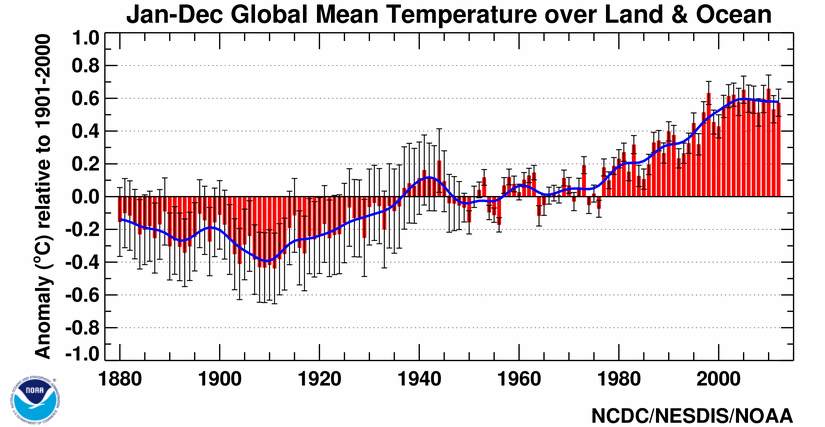 |
|
|
|
Post by guyfromhecker on Feb 24, 2014 19:45:02 GMT -6
OMG, now an article blaming the warming hiatus on volcanism. Last week and the week before they said it was still warming, but hiding out in Africa or the oceans. What rational will we hear next? Of course none of this is actually provable. |
|
|
|
Post by Frivolousz21 on Mar 29, 2014 7:15:35 GMT -6
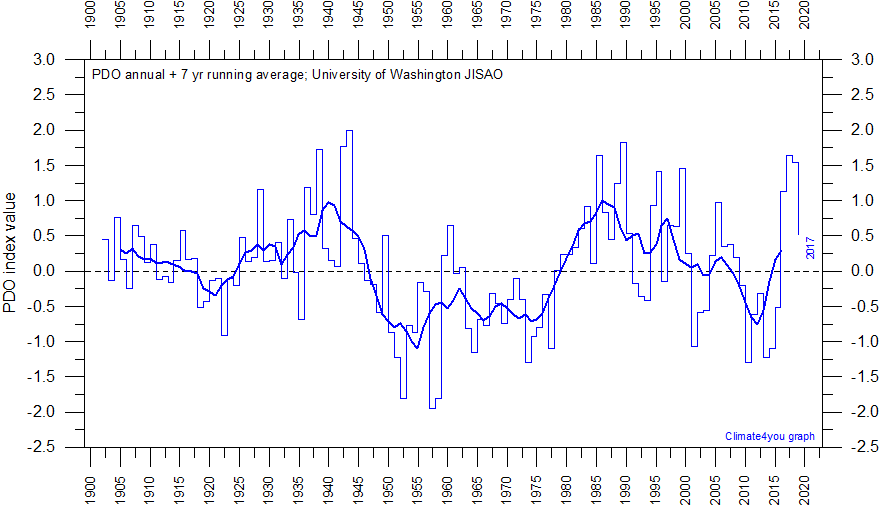
TSI has been dropping for decades now but has really plummeted since the mid 2000s. While it may take a decade or more for an equilibrium to be reached. There is still an immediate impact in incoming shortwave radiation. Even if it's small. Combine that with longer term feedback of the ocean OHC adjusting to weaker solar forcing and there should be an immediate but even stronger longer term cooling. Add in that we have also seen an abrupt shift to a negative PDO in the late 90s then an above normal period before it totally tanked in 2007 would also cause an abrupt cooling trend as well as a longer term one. We can see below the PDO peaked around the mid to late 1980s and has been dropping since. It has recently plummeted. Literature estimates upwards of a 0.2C fluctuation in global warming or cooling pending the cycle. Add that to the estimated -0.05 to -0.10C cooling the solar cycle change should have given us by now. And that would add up to a total of around -0.25 to -0.35C from the 1980s to now. Yet we have seen no cooling. While surface temps and lower troposphere temps have flattened out since the 2002-2005 we have seen no cooling nor have we seen OHC drop which is still rising albeit slower than the 1980s and 1990s for now.We also have to add the ENSO effect which is also covered by the PDO by and large. The 2002-2007 period saw 5 of 6 years be enso neutral to nino. Before a major nina in late 2007-08 which started a 5 of 6 year period of 4 ninas and one neutral year which was essentially nina status.
This has occurred in concert with the largest solar spot/tsi drop in 100 years as well as the weakest solar max since the 1920s and yet we haven't seen any cooling nor any drop in OHC uptake.
During this period we have seen global land ice loss abruptly rise, Spring and Summer snow cover plummet, arctic sea ice plummet as well. The difference between these occurances and things like surface temperature is that they are far more effected by atmospheric particulates and direct solar forcing that can cause large changes in feedbacks and impacts in albedo.
There is well documented evidence that land ice in the Northern Hemisphere above 35N or so was greatly subjected to these dark particulates like soot from the industrial revolution. Ice core data as well as observable data backs this up at many glacial sites including GIS showing a build up of these particulates during the late 19th thru a lot of the 20th century before regulations helped curb this pollution.
These particulates essentially stick to the melting ice on glaciers even with massive water run of. This causes the albedo of the ice surface to drop substantially since the particulates darken the surface absorbed far more heat that the ice and snow does then radiates into the ice it's sitting on. As the ice melts more and more they build up causing in many cases a dramatic albedo shift.
This explains why land ice melt has been off the charts the last 10 years even though air temps haven't risen. This has been documented everywhere on Earth. But it's least prevalent as you get to the South Pole. Most prevalent along the sub tropical regions because of massive pollution from India and China and still strong towards the North Pole by in large thanks to a century of build up.
The most effected region is the tibet region which is suffering from devastating glacial ice loss. Another region crushed by this is the GIS ice sheet. Areas(about 15% of the ice sheet) have melted down enough to reach the dirty layers from the industrial revolution. It doesn't snow enough in winter to cover it up for an entire Summer so as soon as the fresh snow is melted off the albedo plummets and melting rises expotentially. It's so powerful It helps create a localized region of unnatural warmth over parts of the Western GIS ice sheet.
We also have to add in the massive increase in aerosol particulates coming out of India and China. While global aeresols have leveled off or slightly dropped since the 1990s aeresol concentrations have risen dramatically over the sub tropics. Even with overall levels being slightly lower the impact on solar insolation is still a substantial negative feedback because the region of contamination is over the tropics where the Earths area is largest and they are highly concentated where solar forcing is very strong almost year round.
This graphic is from 2010 but shows the massive aerosol production over that region. In fact when you combine this with the persistent NINA leaning ENSO state this would be a double whammy of a negative feedback to slow or even lower OHC uptake over the equatorial Pacific region.

   OHC has been rising still slowly since it leveled off in late 2004 into 2005. which happens to conveniently line up with the major solar TSI drop, massive increase in equatorial region aerosol production, and the big PDO drop. I doubt it's a coincidence. OHC below 700M has continued to rise dramatically. OHC has been rising still slowly since it leveled off in late 2004 into 2005. which happens to conveniently line up with the major solar TSI drop, massive increase in equatorial region aerosol production, and the big PDO drop. I doubt it's a coincidence. OHC below 700M has continued to rise dramatically.
OHC 0-700M slowed down after 2004 but has still been rising. since early 2012 it has started to rise faster again. 2011, 2012 and then 2013 all broke the previous yearly record for OHC. However 2013 broke the record by a large amount. These graphics below only go to December and do not account for the massive ENSO region OHC buildup that is just starting to explode into the NINO that is going to help crush the global temp records.
  This is truly amazing. This is much larger than the 1997 super nino buildup and faster. a strong NINO is next to certain. A Super NINO is almost likely now. The amount of heat released during this event is going to be tremendous it is also coinciding with the time of year temp anomalies are the largest during the late Summer/Fall of the NH when the oceans are still warm and the sea ice is way below normal.  Currently global temps from the CFS reanalysis are running at a .25-.30C anomaly which is equivalent to a.80 to .85C on GISS the yearly record is .68C+ on GISS in 2010 and 2005. So far this year the average for Jan/Feb is .575C+. March is projected to be .675C+ roughly. That puts the first trimester at .61C+ with an erupting NINO. Chances of 2014 breaking the temp record are very good. The "hiatus" will be over and GHGs are still rising as fast as ever with no end in sight.
Here is an animation I made. We can see the quick onset of NINO.

Atmospheric CO2 - Weekly Data
Mauna Loa Observatory | NOAA-ESRL Data
Week
Atmospheric CO2
March 16 - 22 2014
400.76 ppm
(last week)
March 16 - 22 2013
397.37 ppm
(1 year ago)
March 16 - 22 2004
379.13 ppm
(10 years ago)
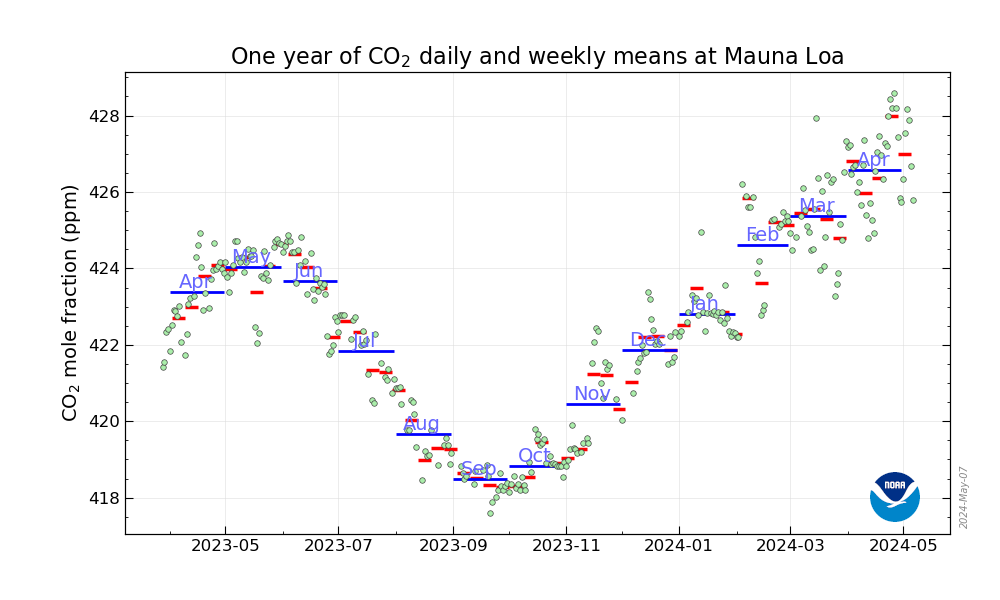
|
|
|
|
Post by Frivolousz21 on Mar 29, 2014 7:28:38 GMT -6
It would definitely have to do with effecting the patterns versus some sort of specialized cooling.  Overall temps in the arctic the last 65 years have risen about 4C on average.   |
|
|
|
Post by csnavywx on Mar 29, 2014 20:44:08 GMT -6
There's a substantial positive SST anomaly emerging near the dateline, that will prove important in helping evolve this Nino as it begins to interact with the atmosphere and weaken the trade winds further.
Related to the Mauna Loa CO2 record, a big Nino would probably push us to our first 3+ppm increase in a year, especially if big droughts take hold over the Amazon and Indonesia (as they have in the past with big Ninos).
|
|
|
|
Post by csnavywx on Jul 22, 2014 21:01:29 GMT -6
May and June global temps were both records on NOAA. Spring (MAM) was the hottest on record for just about any dataset used. June sea surface temperatures were very warm, setting a record at +0.64C (1.1F). Land temps were around 2F above normal.
So, despite continued subdued solar activity and a lack of any significant Ninos, we continue to set records. The numbers continue to speak for themselves.
|
|